Data describes the daily activities that you like to do. Data visualization interacts with the data. Visualization comes out with presentation of real life. It attracts your audience and people often get interesting. Looking for the data visualization tools to prepare killer presentation? Scroll & Read this informative article, where we have made a list of 12 best data visualization tools for you. It’s hard to pinpoint the right tool; the features of these tools will help you to choose a better one. Keep reading and enjoy some awesome data visualization tools available on the web.

12 Best Data Visualization Tools:
This open source library chart is perfect one for small businesses/projects. It offers 6 chart types with flat designs and quick response. To get more information, browse the Chart.js link.
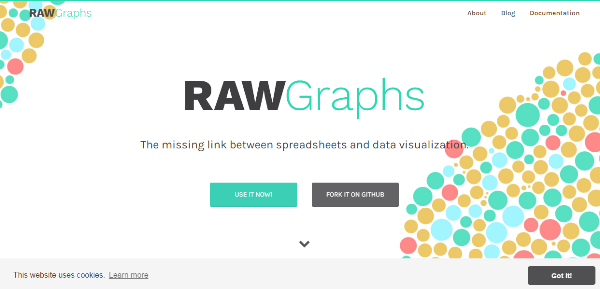
Raw is one of open source and scale-able data visualization tools. It allows its user to create vector based data visualization. You can upload data from apps to computer. Browse the link and download this free tool.

This is a java script charting library which allows you to create interactive HTML chart. It offers 100 plus chart for your data visualization project.
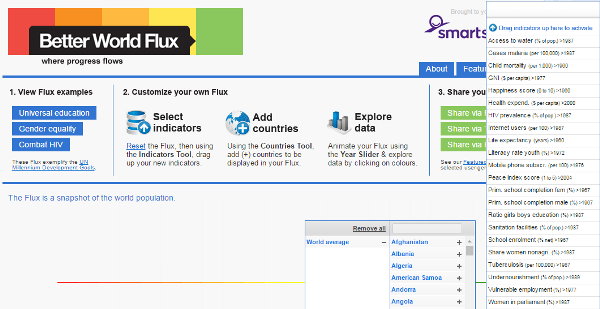
Better world Flux is one of beautiful data visualization tools which allow its user to create interactive graphics ideas. It has a video demo on you tube. Browse the link to checkout more interactive features and get more information.
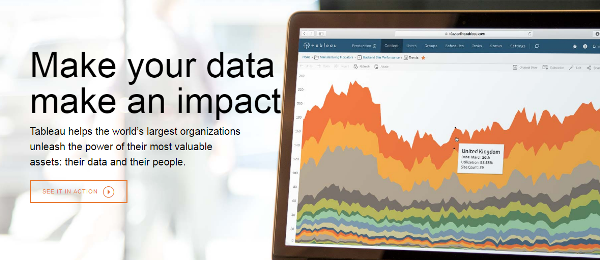
Tableau allows its user to create charts, graphs and maps. This is considering as one of best data visualization tools which include Barclays, Pandora and citrix.
-
Visually:
This is the one of popular online data visualization tools in these days. It provides the handful of partner pages. It offers the social networking features.
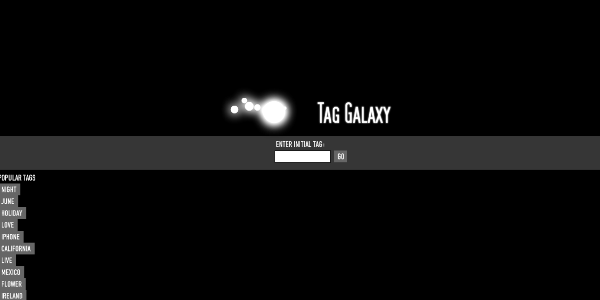
It is unique, clean and easy to understand tool with single page interface. It is the one of coolest data visualization tools. Click on link to view more features and full view of this tool.
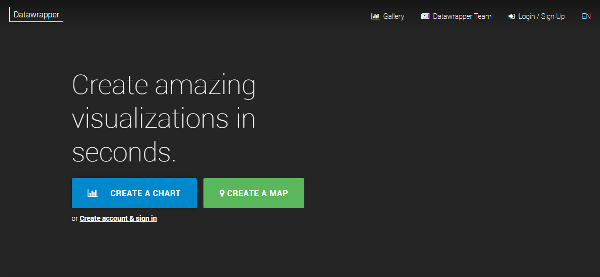
Create and publish your data through data wrapper. This is easy to use; you don’t need any coding to execute it. Custom layouts are integrated to data wrapper.
-
Ember charts :
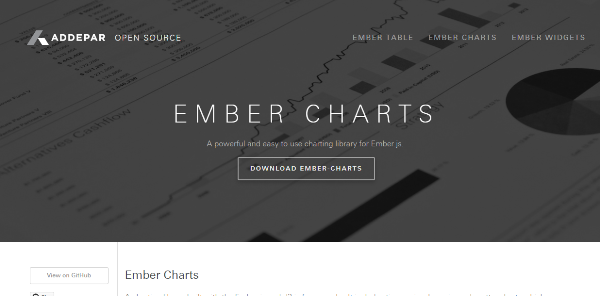
Ember chart includes the features of bar, pie chart and scatter charts to modify and extend to your data to next level of visualization. This will not crash while you are using large amount of data. Error handling is a graceful feature of Ember.
Chartist is one of simple and quick responsive data visualization tools. This is popular handy tool among developers to create chart library with richer features and impressive.
-
Exhibit:
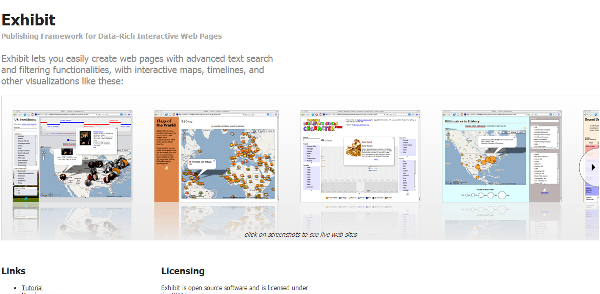
Exhibit includes interactive maps, timelines and other visualization tools. It helps you to create web pages with good functionality and features. Browse the more features by simply clicking the above link.
JPgraph is one free data visualization tools which offer PHP based charts. It includes scatter, bar, pie, polar and other types of charts. It support to 400 color of chart. Checkout the more features by clicking JPGraph link.